

With a background in petroleum geology, I'm familiar with the inherent underdetermination inherent in geoscience problems, where solutions are often constrained by existing technologies. Statistical and stochastic techniques are frequently employed to address these uncertainties. However, in my transition to the business side, I've observed a preference for deterministic approaches over probabilistic modeling. To illustrate this difference, I'll use a simple box volume example to compare deterministic and probabilistic methods.
Given the heterogeneity and uncertainties of the subsurface, geoscientists assess hydrocarbon resources or reserves through a volumetric method:
The abbreviations mean
GRV: gross rock volume
Phi: porosity
Sat: Saturation of hydrocarbons
RF: Recovery factor
FVF: Formation volume factor
Evaluating the economic viability of a potential oil or gas field hinges on accurately estimating the recoverable hydrocarbon volume throughout its production lifespan. However, subsurface uncertainties and inherent geological variations complicate this process. Consequently, management often relies on deterministic scenarios, typically categorized as low, mid, and high cases (representing worst-case, base-case, and best-case recoverable volumes).
When dealing with formulas containing uncertain variables, a common practice is sensitivity analysis. This involves isolating specific parameters by fixing their values while modifying others. For simple formulas, like a basic multiplication of two variables, the resulting range of outcomes is readily apparent. However, as the number of variables in a complex multiplication formula increases, visualizing the range of potential outcomes and the associated uncertainty band becomes progressively more challenging.
Box Volume
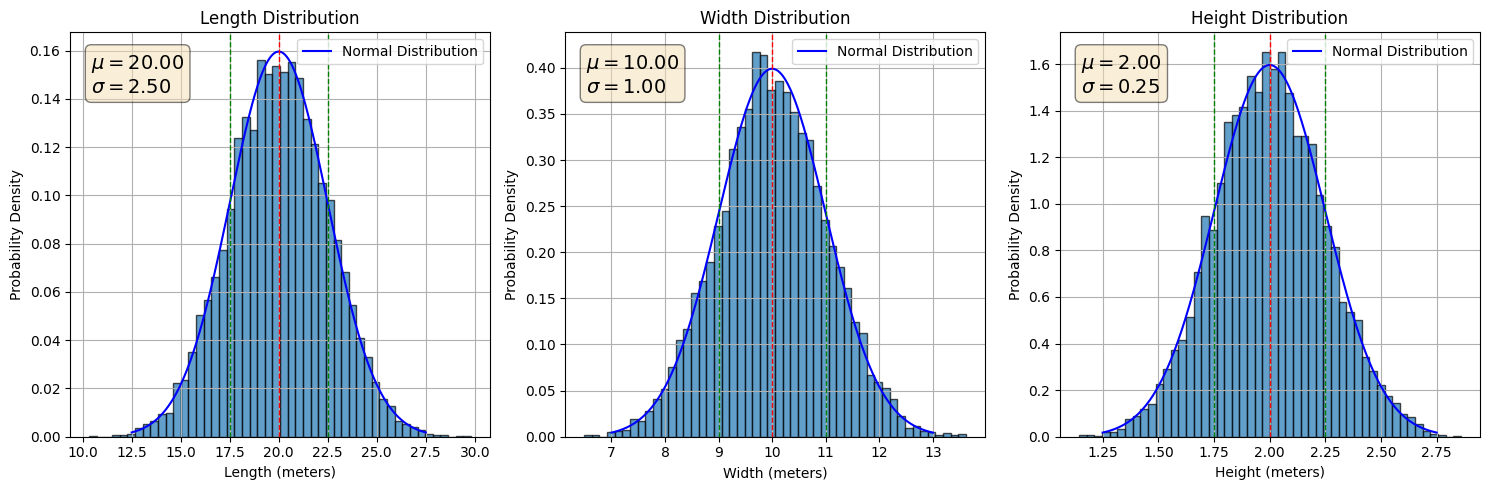
Imagine we need to determine the volume of a box, but lack any measuring tools. In this scenario, we can leverage the power of human estimation. By gathering a group of individuals and having them independently estimate the length, width, and height of the box, we can arrive at an mean (average) and standard deviation for each dimension.
Length (L) - mean: 20m, standard deviation: 2.5m
Width (W) - mean: 10m, standard deviation: 1m
Height (H) - mean: 2m, standard deviation: 0.25m
As a reminder the standard deviation is a measure of how spread out data is from its mean or average.
Deterministic cases
We can simply calulate the volume using the mean values:
By subtracting or adding the standard deviation to the mean for each dimension (length, width, and height), we can establish a low and high case for the box's volume. This approach provides a probabilistic range that captures a significant portion of the potential volume values, acknowledging the inherent uncertainty in our estimations.
High case:
Low case:
However, I am not sure whether that the best way. I remember from my math class that error propagation should be done differently….
Probabilistic modeling
Leveraging the known mean and standard deviation, we can generate theoretical normal distributions for the length, width, and height of the boxes. We then perform 10,000 simulations, drawing random values from these distributions for each dimension. These simulated values are subsequently grouped into 50 bins for visualization in the accompanying histogram. The superimposed blue curve represents the ideal normal distribution, while the vertical dotted red line indicates the mean value. The flanking dotted green lines depict the one standard deviation intervals around the mean.
The following figure depicts the distribution of box volumes. We simulated the volume by multiplying random values for length, width, and height 10,000 times. The resulting data is visualized in a histogram with 50 bins. As you can see, the distribution is not perfectly symmetrical; instead, it exhibits a skew towards the left.
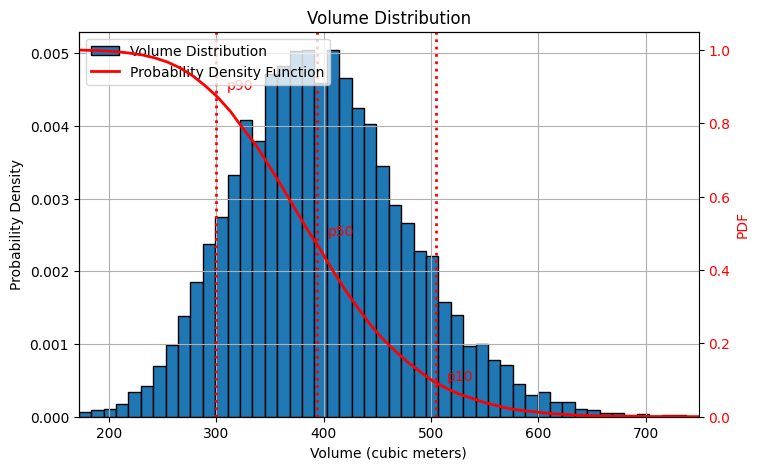
It's important to note that I'm using the European P90/P50/P10 convention, where these values represent the probability of exceeding a certain threshold. In other regions, these values may represent the probability of falling below a threshold.
Here's how I interpret the results in this example:
P90 (300m³): There's a 90% chance the actual box volume will be greater than or equal to 300 cubic meters. (Note: The actual value might be slightly higher than 299.75m³ due to rounding.)
P50 (390m³): There's a 50% chance the actual box volume will be greater than or equal to 390 cubic meters. This value (395.64m³) is close to the deterministic mean we estimated earlier.
P10 (510m³): There's a 10% chance the actual box volume will be greater than or equal to 510 cubic meters. (Note: The actual value might be slightly higher than 509.98m³ due to rounding.)
Deterministic vs. Probabilistic Approaches: Embracing Uncertainty
Traditionally, assessments often rely on deterministic scenarios, such as low, mid, and high estimates (representing worst-case, base-case, and best-case outcomes). While these provide a starting point, they can be limiting.
Probabilistic modeling offers a more nuanced perspective by incorporating uncertainty into the equation. This is achieved through techniques like P90, P50, and P10, which represent the probability of exceeding a specific value. In our box volume example, P90 signifies a 90% chance the actual volume is at least 300 cubic meters, while P50 indicates a 50% chance it's at least 390 cubic meters (close to the deterministic mean). P10 reflects a 10% chance of exceeding 510 cubic meters.
This probabilistic approach provides several advantages:
Richer Information: It goes beyond a single point estimate (like the mean in deterministic cases) and reveals the entire distribution of potential outcomes.
Uncertainty Quantification: It explicitly acknowledges and quantifies the inherent uncertainties in estimations, offering a more realistic picture.
Risk Management: By understanding the probability of exceeding or falling below specific thresholds (P90, P50, P10), stakeholders can make more informed decisions that account for potential risks.
In essence, probabilistic modeling empowers us to move beyond point estimates and embrace the inherent uncertainties in real-world scenarios. This deeper understanding of the distribution of possibilities is crucial for informed decision-making, particularly when dealing with complex projects like offshore wind farm IRR estimations.
This rewrite highlights the limitations of deterministic approaches and emphasizes the benefits of probabilistic modeling in terms of richer information, uncertainty quantification, and risk management. It also connects the concept to your upcoming application in the offshore wind project.
Given that random numbers are picked, the results after 10,000 simulations will look slightly different.