


Beyond FiT: How Co-located PV & BESS Can Optimise Solar Revenue in Germany's Wholesale Market
An analysis of Day-Ahead pricing and strategic dispatch for maximizing PV plant revenue in volatile grids.

The evolving landscape of electricity markets, particularly in regions with high renewable penetration like Germany, presents both challenges and opportunities for power producers. Understanding market dynamics, especially Day-Ahead (DA) pricing, is crucial for optimizing revenue streams. This article explores the potential revenue generation for a hypothetical photovoltaic (PV) plant operating solely on the wholesale market in Germany, without the safety net of Power Purchase Agreements (PPAs) or Feed-in Tariffs (FiTs).
My analysis focuses on the month of April 2025, a period characterized by exceptionally high solar irradiance in Germany. While this month may not be representative of the entire year, it offers a compelling case study for examining the interplay between solar generation and market pricing.
The provided data reveals several key insights:
Daily DA Price Curves (Upper Chart): This chart vividly illustrates the "duck curve" phenomenon, a characteristic pattern in electricity demand and supply profiles heavily influenced by solar generation. Daily prices fluctuate significantly, reflecting the dynamic balance between generation and consumption. Notably, dashed lines indicate Saturday, Sunday, and German public holidays, often associated with lower demand and thus, price variations.
Distribution of DA Prices (Middle Chart): A histogram of DA prices across April 2025, with a bin size of 5.00 EUR/MWh, provides a clear overview of price frequency. The mean price for the month was 77.40 EUR/MWh, with a wide range from a minimum of -109.86 EUR/MWh to a maximum of 214.16 EUR/MWh. This wide spread highlights the volatility of the wholesale market.
Daily Maximum Spread (Lower Chart): This plot tracks the maximum daily price difference throughout April. It's interesting to observe that local spikes in the spread often coincide with weekends, likely due to reduced industrial demand and a higher proportion of intermittent renewable generation.

A significant finding from my analysis is the occurrence of negative DA prices: in April 2025, there were a total of 73 hours where prices dropped below zero, equivalent to more than three full days. This phenomenon underscores the challenges of grid balancing in periods of oversupply from renewables.
In analogy to April, I also analysed the DA pricing data for May 2025, and distinct differences emerged. May saw a significant intensification of market patterns, primarily:
Increased Negative Prices: The number of negative DA price instances surged from 75 in April to a notable 129 in May, indicating more frequent and deeper periods where supply exceeded demand.
More Pronounced "Duck Curve": While April already showed midday price troughs characteristic of the "duck curve," May's daily price curves exhibited even deeper and more consistent midday dips, often pushing prices further into negative territory. This suggests a higher volume of solar output having a greater impact on market prices.
Higher Price Volatility: The average daily maximum price spread rose from 152.92 EUR/MWh in April to 169.00 EUR/MWh in May, with a corresponding increase in the standard deviation of this spread (from 51.11 to 68.10 EUR/MWh). This indicates an even greater hourly price variation within the Day-Ahead auction results.
Slightly Lower Mean Price: Reflecting the increased supply-side pressure, the mean DA price slightly decreased from 72.84 EUR/MWh in April to 67.44 EUR/MWh in May.

Hypothetical PV Plant Revenue Scenarios
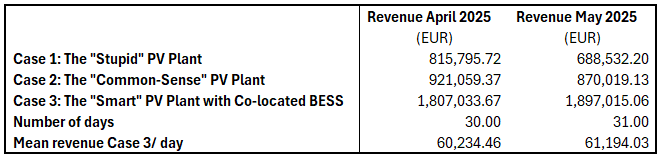
To quantify the financial implications of operating a PV plant without PPAs or FiTs, I designed three hypothetical cases, focusing solely on revenue generation and intentionally excluding Capital Expenditure (CAPEX), Operational Expenditure (OPEX), and other associated costs for simplicity.
My model assumes a 100 MWp PV plant with a 100 MW grid connection. The DA pricing data was sourced from Ember, and PV generation curves were generated using Google's Gemini.
Case 1: The "Stupid" PV Plant This baseline scenario represents a PV plant that sells all its generated power onto the wholesale market, regardless of the price, even when prices are negative. This highlights the financial impact of unmanaged market exposure.
Case 2: The "Common-Sense" PV Plant In this scenario, the PV plant exercises a basic level of market awareness by curtailing power generation whenever the DA price drops below 0.00 EUR/MWh. This simple strategy aims to avoid incurring costs by selling into negative price environments.
Case 3: The "Smart" PV Plant with Co-located BESS This advanced scenario incorporates a co-located Battery Energy Storage System (BESS) to optimize revenue. The system's specifications are:
PV Plant: 100 MWp
BESS: 400 MWh / 400 MW
Grid Connection: Remains at 100 MW
The smart system employs a strategic dispatch algorithm:
Charging Strategy: The BESS charges when DA prices are low, specifically when PV generation would otherwise be sold into the grid at prices below 20 EUR/MWh. This effectively stores cheap energy.
Discharging Strategy: The BESS discharges stored energy to the grid when DA prices are high, specifically from 80 EUR/MWh onwards. This maximizes revenue by selling power during peak price periods.
By comparing these three cases, I aim to illustrate the substantial financial benefits that can be unlocked through intelligent market participation and the integration of energy storage solutions, particularly in volatile wholesale electricity markets.
Results
It is important to acknowledge several simplifications within this model:
Algorithm and Foresight: The trading algorithm employed is intentionally simplistic, primarily defining whether solar energy is sold directly or used to charge the BESS for later discharge. While this model assumes perfect foresight of Day-Ahead pricing, real-world traders leverage sophisticated meteorological forecasts and predictive models for renewable energy production to inform their short-term strategies.
Market Scope: This analysis is confined solely to the Day-Ahead auction. In practice, a PV+BESS optimizer would also engage in the Intra-Day (ID) market and potentially deploy the BESS for various ancillary services (e.g., FCR and aFRR) or other non-frequency services.
BESS Flexibility: Beyond PV self-consumption, a BESS can also be charged directly from the grid, particularly during off-peak hours when power prices are typically low (e.g., due to high wind production). Furthermore, clever traders in Germany might engage in more financial trading strategies, effectively using the physical asset as a backup for virtual MWh transactions.
Optimization Potential: The modeled BESS exhibited a cycle rate of approximately 0.7 cycles/day, suggesting potential for further optimization and uplift in its utilization.

Disclaimer and Financial Considerations (Back-of-the-Envelope)
It is important to acknowledge that the data from April and May 2025 may not be fully representative of the average solar irradiation levels across the entire German calendar year, as solar resources vary significantly by season. Furthermore, Day-Ahead electricity prices are subject to dynamic evolution, heavily influenced by the ongoing energy transition and the increasing deployment of PV and Battery Energy Storage Systems (BESS) capacities.
This analysis includes a simplified, "back-of-the-envelope" calculation to roughly estimate the scale of required revenues for such a project:
Total Capital Expenditure (CAPEX):
Assuming a BESS CAPEX of 220 kEUR/MWh, a 400 MWh system would incur an estimated 88 million EUR.
For a 100 MWp PV plant, an estimated CAPEX of 1,100 EUR/kWp (or 1.1 kEUR/kWp) translates to approximately 110 million EUR.
This results in a combined estimated CAPEX of approximately 198 million EUR, which we round to 200 million EUR for simplicity.
Required Annual Revenue (Simplified):
Based on an assumed BESS lifetime of 20 years, a PV plant lifetime of 25 years, and a target annual return on investment (ROI) of 10%, a yearly revenue in the range of 20 to 24 million EUR would be necessary to cover the capital investment and achieve the desired return. This equates to approximately 1.7 to 2 million EUR per month, prior to accounting for operational expenditures (OPEX).
Given the observed trend of declining CAPEX for both PV and BESS technologies, coupled with the significant potential for additional revenue streams from other markets (e.g., Intra-Day trading, ancillary services), these estimated revenue targets appear to be within a plausible range for a commercially viable project, despite the simplified financial sizing presented."
Finally, it is crucial to acknowledge that project financing typically sees lenders prefer long-term FiT or PPA structures (10-25 years). This necessitates a shift in mindset within the financial sector to become comfortable with these new revenue streams, which, while potentially offering higher returns, may also carry increased market risks.
While earlier analyses also explored revenue streams for standalone BESS configurations, please refer to links below, this section focuses on a simplified, "back-of-the-envelope" calculation to roughly estimate the scale of required revenues specifically for this co-located PV+BESS projects.
A significant advantage of co-location is the ability to charge the BESS behind the meter, implying no grid fees are levied on this stored energy. At present, standalone BESS are also exempted from grid fees in Germany1, though this policy might change over the next years. Furthermore, co-located PV+BESS assets could become increasingly active in the ancillary service market, opening up further revenue opportunities beyond wholesale energy trading.
Investing into BESS

Renewable energy assets, such as wind and solar farms, are favored by investors due to their predictable revenue streams generated through long-term contracts like government-backed feed-in tariffs, PPAs or CfDs, and more. Battery energy storage systems (BESS) often complement these by storing excess renewable energy for later discharge, enhancing grid …
and
Stacking the Deck: Unlocking BESS Revenue Streams

Energy projects, particularly those involving capital-intensive ventures like LNG or renewables, often require substantial financing. While equity can be a source, debt is generally preferred due to its lower cost. However, securing debt for projects in illiquid markets can be challenging. To mitigate risks, lenders like banks often demand collateral, s…
Gesetz über die Elektrizitäts- und Gasversorgung (Energiewirtschaftsgesetz - EnWG) § 118 Übergangsregelungen https://www.gesetze-im-internet.de/enwg_2005/__118.html