Cracking the Nutty Oil Market: An Brief Analysis of Edible Oil Prices (2000 to Present)
Navigating the Global Landscape of Cooking Fats
Living in Malaysia means endless vistas of palm oil plantations – a testament to its omnipresence. While media often casts palm oil as a villain due to monoculture and deforestation, it's crucial to remember that sustainable production methods do exist and are gaining traction.
However, in our German-Portuguese household, olive oil reigns supreme, with sunflower oil primarily for popcorn, and butter (sourced from animals) for silky Béchamel or a decent German Schnitzel only. My "silly European mindset," seasoned with a dash of Argentine diaspora - with plenty of blooming sunflowers in the Pampa - and a small stint in North America, once led me to believe sunflower seed and canola oil (those pretty yellow flowers also converted into biodiesel) would top the global charts of vegetable oils.
According to data from the USDA1, palm oil leads the world’s vegetable oils, closely followed by soybean oil. Largest palm oil producers are Indonesia and Malaysia. Our household's humble pantry clearly doesn't reflect this global behemoth. Beyond our kitchens, palm oil is, as the WWF2 points out, literally everywhere:
“…it’s in close to 50% of the packaged products we find in supermarkets, everything from pizza, doughnuts and chocolate, to deodorant, shampoo, toothpaste and lipstick.”
My recent reading on Bloomberg3 highlighted palm oil's importance (4,000 MYR around 800 US$ pending on the FX rate):
Palm Oil jumped above the 4,000 ringgit mark to track gains in soyoil, which surged on Washington’s proposal to allow refiners to blend a record amount of biofuels into gasoline and diesel next year.
Intrigued, I decided to expand on a short note I wrote last week4 and delve deeper into the dynamics of these vital vegetable oils.
Introduction to Key Edible Oils
This analysis focuses on several pivotal vegetable oils that are central to global trade and consumption. Understanding their market dynamics is crucial as they influence food prices, agricultural practices, and various industries worldwide:
Coconut Oil: Derived from the kernel of mature coconuts, this versatile oil is widely used in food, cosmetics, and industrial applications.
Palm Oil: The most widely produced and consumed edible oil globally, extracted from the fleshy part of the oil palm fruit. It's used extensively in food products, detergents, and as a biofuel.
Palm Kernel Oil: Obtained from the kernel (seed) inside the oil palm fruit. It has a different fatty acid profile than palm oil, making it suitable for specialty fats (like in confectionery) and oleochemicals (e.g., soaps, cosmetics).
Soybean Oil: Pressed from soybeans, it is one of the most widely used cooking oils and a significant ingredient in processed foods across the globe.
Peanut Oil (aka Groundnut Oil): A vegetable oil derived from peanuts, valued for its mild flavor and high smoke point, making it suitable for frying.
Rapeseed Oil (aka Canola Oil): Extracted from rapeseed, this is a popular cooking oil recognized for its lower saturated fat content.
Sunflower Oil: Obtained from sunflower seeds, it serves as a common cooking oil and is an ingredient in many food items.
Olive Oil: A prominent edible oil, particularly in Mediterranean cuisine, often commanding a higher price point due to its production methods and perceived health benefits.
Of course there are many more vegetable nutty oils around, e.g. sesame oil, avocado oils, etc.

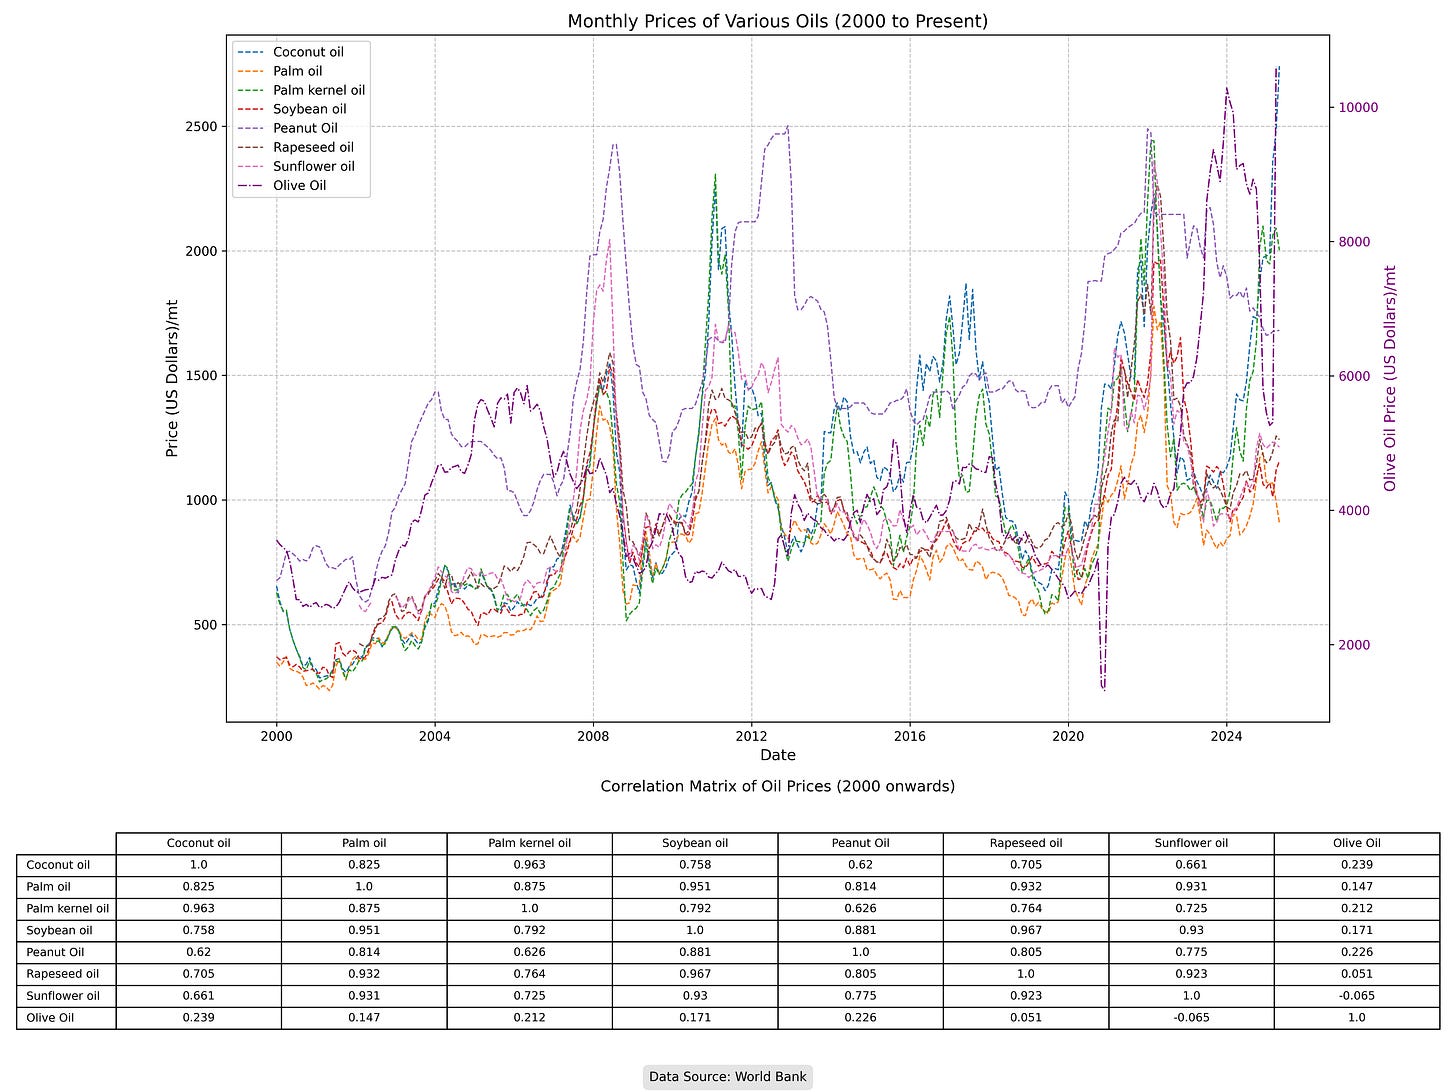
The accompanying chart visually tracks the monthly nominal prices of all eight vegetable oils from January 2000 to the present. Prices for Coconut, Palm, Palm Kernel, Soybean, Peanut, Rapeseed, and Sunflower Oils are plotted against the left y-axis ("Price (US Dollars)/mt"). Olive Oil price data, however, is uniquely plotted against a second y-axis on the right side of the chart ("Olive Oil Price (US Dollars)/mt"), highlighting its distinct price scale. All price series are shown with dashed lines (Olive Oil, which is the dotted purple line for clarity) and are clearly identified by a combined legend.
Below the chart, a "Correlation Matrix of Oil Prices (2000 onwards)" table provides the pairwise correlation coefficients for all eight oils over the same period.
Brief Analysis and Interpretation
1. Price Trends (Chart Analysis):
Overall Volatility and Upward Bias: The chart reveals significant price volatility across most oils, particularly from 2007 onwards. Despite these fluctuations, there's a general upward trend in nominal prices over the two-decade period, with major spikes around 2008, 2011, and a sharp, sustained increase post-2020. This indicates strong market demand and susceptibility to global economic and supply-side shocks.
Co-movement of Bulk Oils: Most oils (Coconut, Palm, Palm Kernel, Soybean, Rapeseed, Sunflower) largely move in tandem, reflecting their interconnectedness and substitutability in global commodity markets. Peanut Oil, while generally following these trends, shows some periods of slightly less direct alignment or smoother fluctuations.
Olive Oil's Distinct Trajectory: Olive Oil, plotted on its separate right-hand axis, generally operates at a higher price band than the other oils. While it shares some broad market trends, its fluctuations appear less directly correlated with the other oils, suggesting it might be influenced by more distinct factors.
2. Correlation (Matrix Analysis):
The correlation matrix confirms generally strong positive relationships among most of the oils. However, it specifically highlights Olive Oil's and Peanut Oil's somewhat unique positions:
High Correlations Among Core Bulk Oils: Correlations among Coconut, Palm, Palm Kernel, Soybean, Rapeseed, and Sunflower oils are predominantly high and positive (e.g., Palm Oil and Soybean Oil at 0.951), indicating strong interdependencies.
Peanut Oil's Slightly Weaker Links: Peanut Oil shows positive correlations, but these are often a bit lower than those found among the most tightly linked bulk oils (e.g., Peanut Oil with Coconut Oil: 0.62; with Palm Oil: 0.814). This suggests its price dynamics are influenced by some additional or different factors.
Olive Oil's Weak/Negative Correlation: Olive Oil stands out significantly, showing notably weaker or even negative correlations with the other oils (e.g., 0.239 with Coconut Oil, 0.147 with Palm Oil, and a slight negative correlation of -0.065 with Sunflower Oil). This is a crucial finding.
3. Interpretation of Divergence (Olive Oil vs. Others):
The distinct pricing and lower/negative correlations of Olive Oil and the slightly different curve of Peanut Oil compared to the other vegetable oils highlight significant market segmentation and unique drivers:
Market Niche & Production Factors (Olive Oil): Olive Oil serves a specialized, often premium, market driven by culinary tradition and highly localized production (Mediterranean basin). Its production is highly dependent on specific regional climate/weather and olive harvests, which do not always align with global agricultural cycles affecting the other oils. This insulates its price movements significantly.
Unique Dynamics (Peanut Oil): While still a bulk commodity, Peanut Oil's slightly less direct alignment and lower correlations suggest that its price movements might be influenced by more specific regional supply-demand conditions or particular crop cycles that don't perfectly mirror the global trends for palm, soybean, or rapeseed oils.
Limited Substitutability: Despite all being edible oils, Olive Oil's unique characteristics and higher price point make it less directly interchangeable with the more generic, lower-priced commodity oils. Similarly, while Peanut Oil is broadly substitutable, its distinct flavor profile and specific regional market characteristics can lead to some independent price dynamics.
In essence, while most vegetable oils behave as an interconnected commodity complex, Olive Oil, and to a lesser extent Peanut Oil, stand out as distinct markets with price dynamics influenced by unique factors that contribute to their limited correlation or slightly different curve compared to other major edible oils.
Concluding Thoughts: Diversifying Your "Veggy Oil" Portfolio
No investment advice should be gleaned from a single blog post, but my dive into the dynamics of vegetable oil markets offers some food for thought. While many vegetable oils move in an interconnected fashion, largely marching to the beat of similar global economic and supply drums, Olive Oil dances to its own tune. Its unique market niche, distinct production factors, and limited substitutability mean it often shows little to no correlation with the big players like Palm or Soybean oil.
Peanut Oil, too, is not fully aligned with the other bulk oil. Its slightly less perfect correlation means a more localized or specific supply-demand cues.
So, if you're ever pondering a "veggy oil" investment strategy, remember this: putting all your eggs (or olives, or palms, or peanuts) in one basket might not be the wisest move. For risk mitigation, diversifying your "veggy oil" portfolio could be a smart play. Perhaps, in addition to eyeing a palm oil plantation, an olive oil grove might be a splendid complement. And for those of us who just enjoy the nuts, a peanut farm (apart from chocolate spread peanut butter is a must-have in our household in Malaysia) sounds like a perfect lifestyle choice, market dynamics notwithstanding!
While some oils are praised for their health benefits and others for their suitability in cooking methods like deep frying – an essential part of Malaysian cuisine – the journey of edible oils extends beyond the plate. A fascinating story highlighting the circular economy recently emerged from The Straits Times5, discussing the conversion of Used Cooking Oil (UCO) into Sustainable Aviation Fuels (SAF). Lastly, for those seeking alternatives to traditional butter in certain culinary applications, ghee could offer a healthier substitution in some instances.
USDA: Oilseeds: World Markets and Trade. June 12, 2025 | World Production, Markets, and Trade Report. https://www.fas.usda.gov/sites/default/files/2025-06/oilseeds.pdf
WWF: 8 things to know about palm oil. https://www.wwf.org.uk/updates/8-things-know-about-palm-oil
Bloomberg: Palm Oil Jumps Above 4,000 Ringgit Mark to Track Soy Oil, Crude. https://www.bloomberg.com/news/articles/2025-06-16/palm-oil-jumps-above-4-000-ringgit-mark-to-track-soy-oil-crude
Turbulence ahead: How used cooking oil could hinder aviation’s green fuel hopes https://www.straitstimes.com/world/turbulence-ahead-how-used-cooking-oil-could-hinder-aviations-green-fuel-hopes


